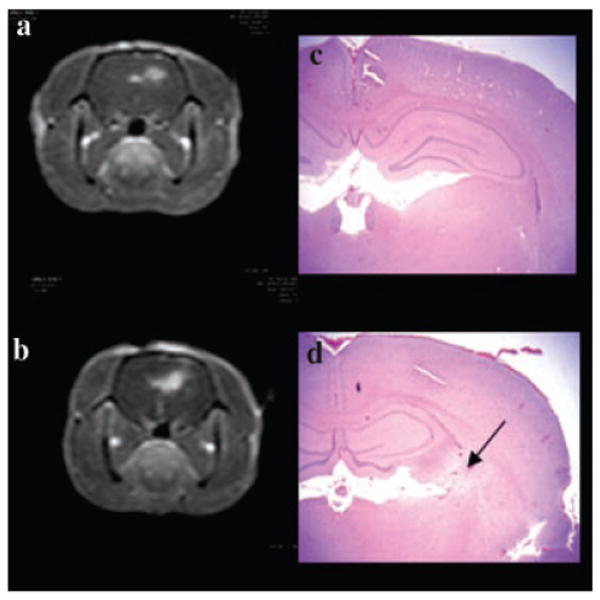
Fig. 2.

T1-weighted MRI contrast enhanced images (a, b) showing focal contrast enhancement centered around the area of light treatment. PDT treatment to a fluence level of 9 (a) and 17 J (b), at a fluence rate of 10 mW was performed 4 hours following ALA administration (125 mg/kg i.p.). Both scans were performed 3–4 hours post-PDT and 15 minutes following i.p. contrast injection. (c, d) Coronal H&E sections from the brains of animals corresponding to a and b taken 14 days post-treatment. In the area exposed to the highest fluence level (5–15 μm from the fiber) no significant pathology was observed following delivery of 9 J (c). At a fluence level of 17 J, extensive infiltration of lymphocytes and macrophages (some loaded with hemosiderin) was apparent as denoted by the arrow in (d).
