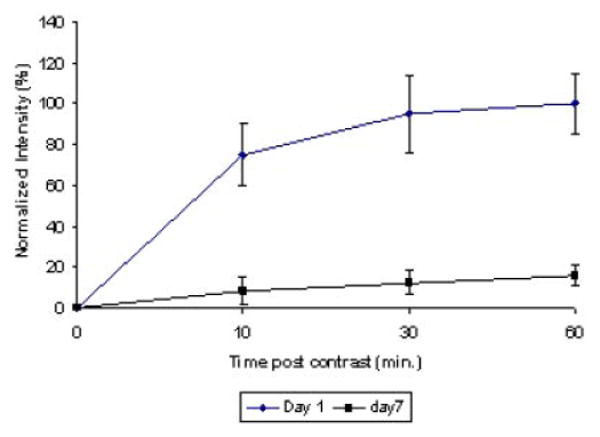
Fig. 7.

T1 signal intensity with time post-contrast injection on days 1 and 7 following light treatment. The signal intensity 24 hours following PDT treatment and 60 minutes post-contrast injection was considered as the 100% point. The rate of flow was clearly biphasic on day 1 with a rapid increase in volume during the initial 10 minutes, following contrast injection and decreasing to a much lower rate following the initial contrast influx. A greatly reduced and linear increase in average intensity with time was observed on day 7.
