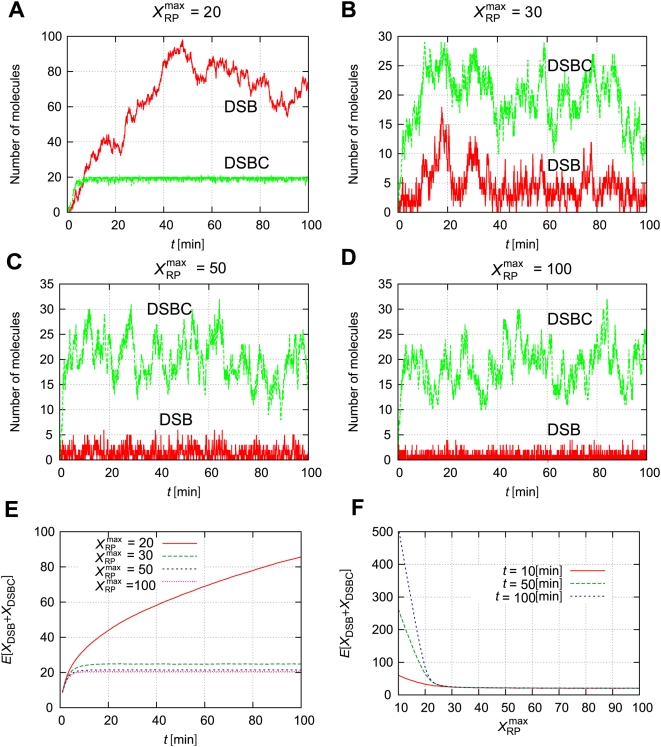
Figure 4. Small differences in  induce a large difference in DSB generation.
(A–D) Time courses of the numbers of DSBs and DSBCs with several values for the maximum number of repair proteins  . (E) Time-dependent expectation values for several
  . (F)
. (F)  expectation values for several times t. Other parameters are as defined in Table 1. Initial numbers of molecules are
  , and
, and  .
.

