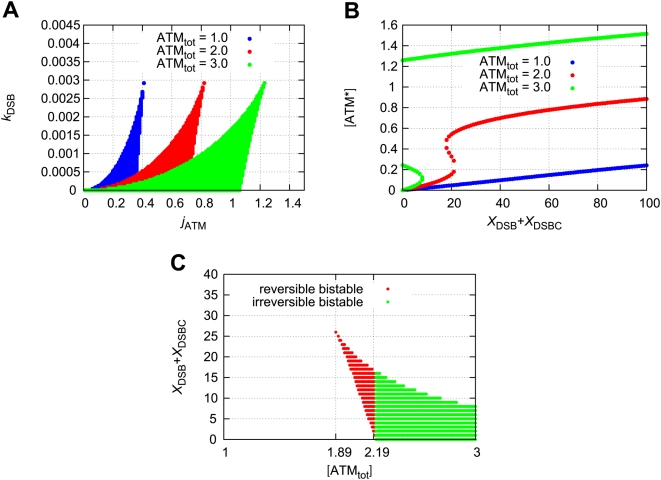
Figure 6. Bistability emerges as the total concentration of ATM increases.
(A) Bistable regions for the rate constants  and
and  with several total concentrations of ATM. The numbers of DSBs and DSBCs are constant
  . (B) The fixed points of [ATM*] as a function of
  with
with  and
and  . (C) Bistable regions for
  and
and  . The red points denote reversible bistability and the green points denote irreversible bistability.

