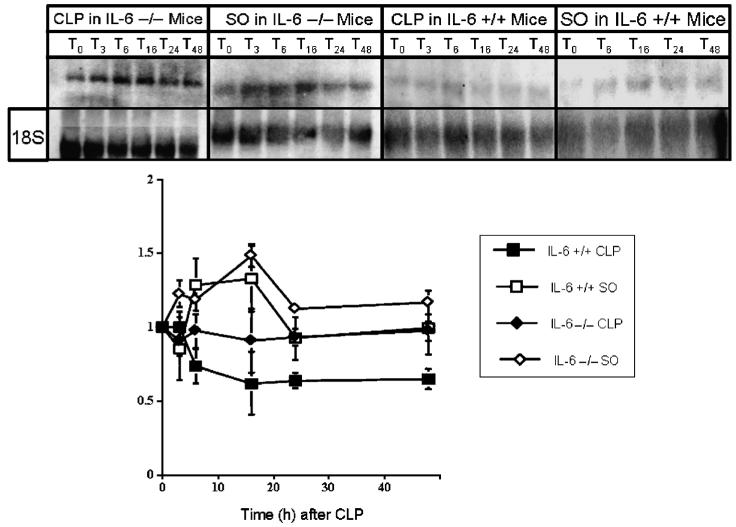
Fig. 5. Representative autoradiograms of Northern blots to determine steady-state mRNA levels of HNF-1α in IL-6 +/+ and IL-6 -/- mice after CLP and SO (top).
Graphic representation of densitometrically determined steady-state mRNA levels of HNF-1α in IL-6 +/+ and IL-6 -/- mice after CLP and SO (bottom). Data as mean ± SD. x axis indicates time in hours after CLP or SO; y axis, normalized density; solid squares, IL-6 +/+ mice subjected to CLP; solid diamonds, IL-6 -/- mice subjected to CLP; open squares, IL-6 +/+ mice subjected to SO; open diamonds, IL-6 -/- mice subjected to SO. Data for HNF-1α normalized to values for the constitutively expressed 18S ribosomal subunit at same time point. Values at time 0 were arbitrarily set at 100. Values for IL-6 +/+ mice subjected to CLP differed significantly from values for IL-6 -/- subjected to CLP and IL-6 +/+ subjected to SO at 6, 16, 24, and 48 h. Values for IL-6 +/+ subjected to CLP differed significantly from values for IL-6 -/- subjected to SO at 3, 6, 16, 24, and 48 h. Differences within and between groups were analyzed using ANOVA with Bonferroni correction.

