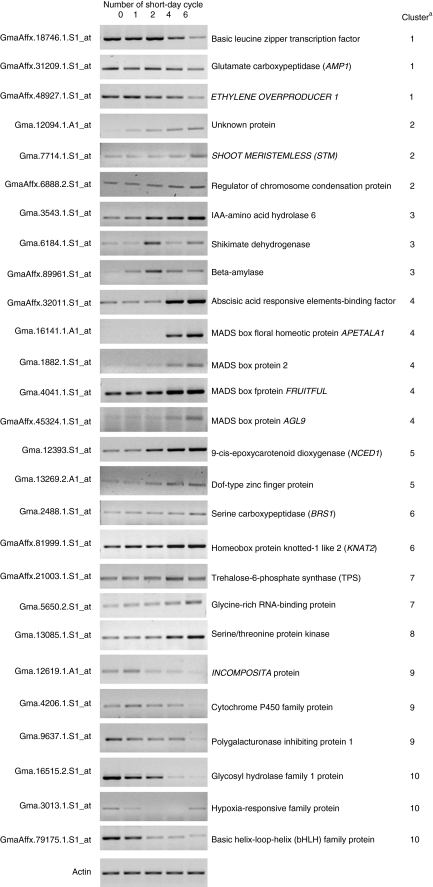
Figure 3.
RT-PCR analysis of selected transcripts. RT-PCR analysis was carried out under linear amplification conditions. A transcript annotated as the actin gene was used as an internal control. aClustering was performed using k-means clustering, as described in the Experimental procedures, and the corresponding profile is shown in Figure 2.

