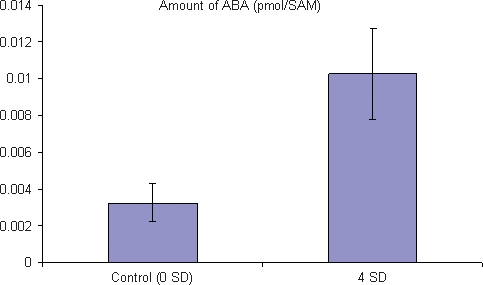
Figure 5.

Measurement of ABA levels in the SAM during the floral transition process.
Data represent mean values of n = 61 plants after 0 short days (SDs) or n = 57 plants after for 4-SDs of two biological replicates (levels of ABA: 0 SD1 = 0.0025, 4 SD1 = 0.012; 0 SD2 = 0.004, 4 SD2 = 0.0085 pmol per SAM); error bars indicate the ranges of the data.
