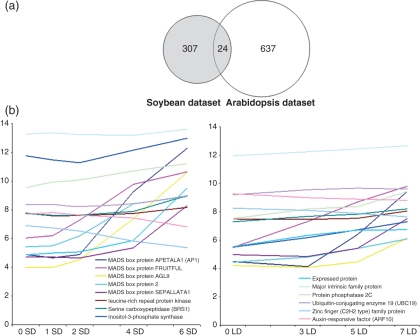
Figure 7.
Comparison of the floral data set derived from soybean (this study) with that of Arabidopsis (Schmid et al., 2003).
(a) A Venn diagram depicting the overlap between transcripts identified to be differentially expressed in response to the floral evocation process in soybean or Arabidopsis.
(b) Expression profiles of orthologous genes in soybean (left panel) or Arabidopsis (right panel).

