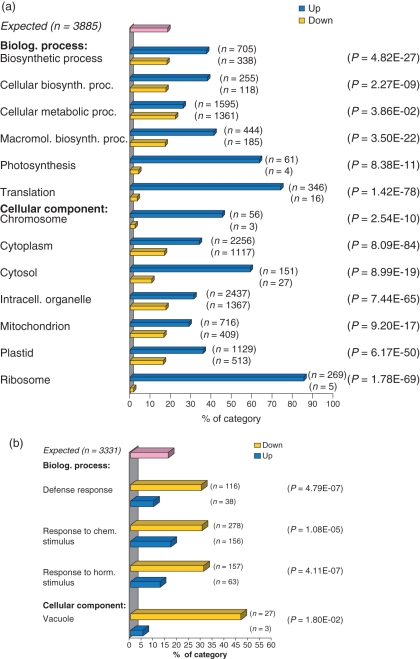
Figure 2. Preferential regulation in gene ontology (GO) categories with relevance to syncytium function.
Preferential regulation of differentially expressed genes for selected GO categories of the two domains ‘biological process’ and ‘cellular component’. The percentage of genes found in the examined subset is shown on the x-axis. The first (pink) bar at the top of each panel thus plots the size of the examined gene set (3331 and 3385, respectively) relative to the chip size. This represents the ratio expected on average if the distribution of examined genes across GO categories matched that of all the genes tested on the chip. For each GO category, a pair of bars compares the numbers of repressed genes (yellow) and induced genes (blue), and the P value for this comparison is displayed on the right. (a) Over-representation of upregulated genes compared with downregulated genes for a representative random selection of categories. (b) Over-representation of downregulated genes compared with upregulated genes in four different subcategories of particular interest.

