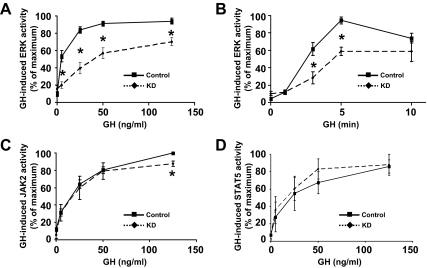
Figure 3.
Densitometric and statistical analysis of GH-induced JAK2, STAT5, and ERK signaling in Control and KD cells. Multiple dose-response experiments (A, C, and D) such as that shown in Fig. 2 and time course experiments (B) were analyzed densitometrically and are plotted as mean ± se relative to the maximal signal obtained within each experiment (100%). Asterisk indicates P < 0.03 for KD compared with Control. A, Dose response of GH-induced ERK activation (n = 9). B, Time course of GH-induced ERK activation (n = 7). C, Dose response of GH-induced JAK2 activation (n = 3). D, Dose response of GH-induced STAT5 activation (n = 3).

