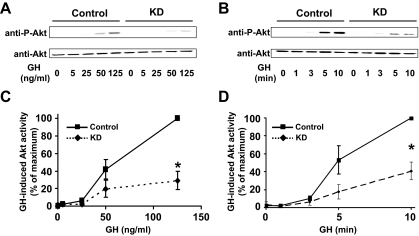
Figure 4.
GH-induced Akt signaling in Control and KD cells. Serum-starved cells were treated with GH with varying doses (0–125 ng/ml) for 10 min (A) and with a single dose (125 ng/ml) for varying durations (0–10 min) (B) before detergent extraction and sequential blotting with anti-P-Akt and anti-Akt. Data from multiple dose-response (C) and time course (D) experiments (n = 3) including those in A and B were analyzed densitometrically and are plotted as mean ± se relative to the maximal signal obtained within each experiment (100%). Asterisk indicates P < 0.03 for KD compared with Control.

