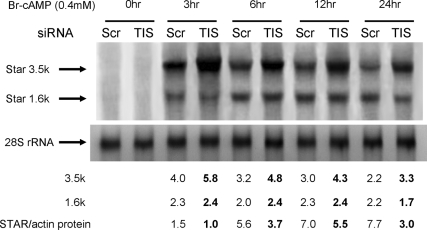
Figure 8.
Effects of TIS11b suppression on StAR 3.5- and 1.6-kb mRNA and protein stimulated by Br-cAMP in MA-10 cells. Northern blot analysis was carried out on StAR mRNA after treatments with either nontarget siRNA or TIS11b siRNA for 48 h. Total RNA was used from the cultures represented in Fig. 7C. The 28S rRNA levels were used as loading control. Quantifications of phosphoimager analyses of Northern blots are shown below the blots as the ratios of StAR/28S signal intensities. Quantifications of StAR protein levels from Fig. 6A are compared.

