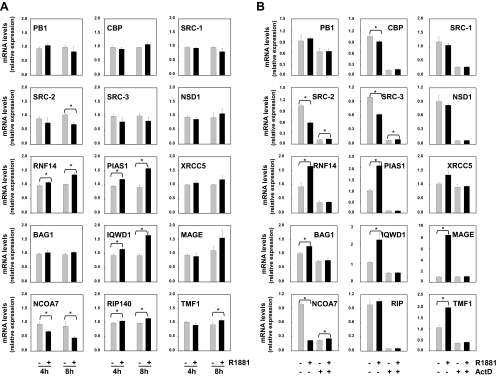
Figure 3.
Characterization of mechanism(s) underlying androgen regulation of coregulator expression. A, Short-term time course. LNCaP cells were treated with 1 nm R1881 (black bars) or ethanol (gray bars) for 4 or 8 h. B, Coregulator expression was analyzed by real-time RT-PCR as described. LNCaP cells were treated for 30 min with actinomycin D (ActD, 5 μg/ml) or vehicle. R1881 (5 nm) (black bars) or ethanol vehicle (gray bars) was added. After 16 h, coregulator expression was assessed by real-time RT-PCR as described. Columns indicate mean values from samples in triplicate; bars, sem values; *, statistically significant changes (P <0,05) as determined by t test.

