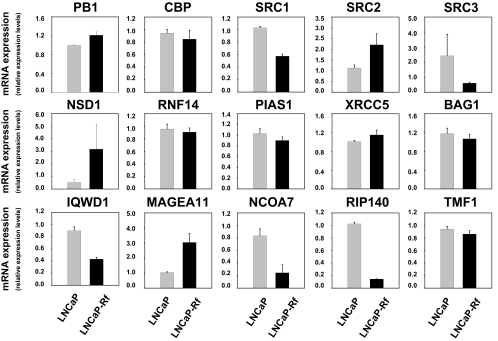
Figure 5.
Real-time RT-PCR evaluation of differential expression of coregulators in isogenic LNCaP cells. LNCaP (gray bars) and LNCaP-Rf cells (black bars) were seeded in their regular medium. Cells were harvested 3 d later, and total RNA was isolated. Real-time RT-PCR was performed as described. Values are expressed as relative expression levels, taking the value obtained from one of the LNCaP-derived samples as 1. Columns represent means of values obtained from three independent biological replicates; bars, sem values.

