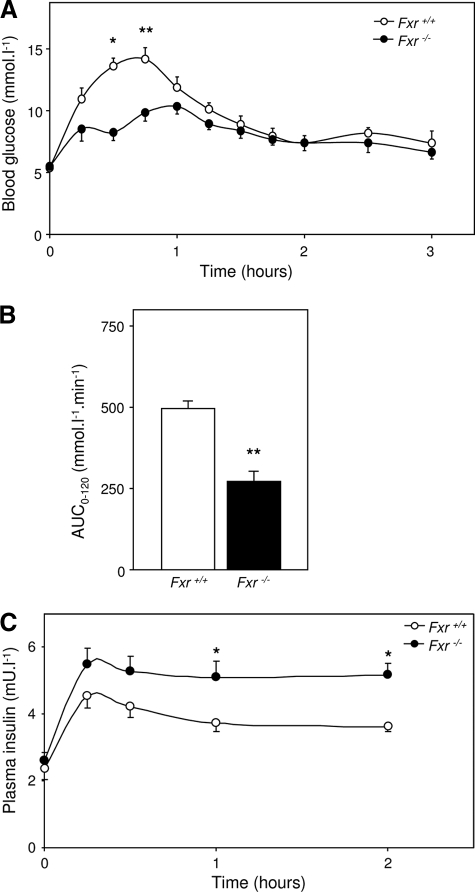
FIGURE 1.
Blood glucose and plasma insulin concentrations during an OGTT. 9-h fasted male wild-type and Fxr–/– mice were subjected to an OGTT (5.6 mmol·kg–1). A, blood glucose levels during the OGTT. B, the area under curve of the excess of blood glucose level (base line is time point 0 and time points 120–180 min). C, plasma insulin levels during the OGTT. The values are averages ± S.E. (n = 5). *, p < 0.05; **, p < 0.01.

