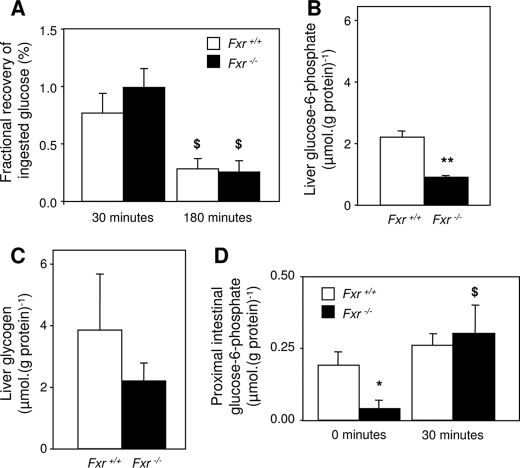
FIGURE 4.
Contents of metabolites in liver and intestine. 9-h fasted male wild-type and Fxr–/– mice were subjected to an OGTT (11.3 mmol·kg–1, from which 30% was d-[U-13C]glucose). A, fractional recovery of ingested glucose in the lumen of the small intestine 30 and 180 min after the oral glucose bolus. B, hepatic G6P concentration 30 min after the oral glucose bolus. C, hepatic glycogen concentration 30 min after the oral glucose bolus. D, proximal intestinal G6P concentration 30 min after the oral glucose bolus compared with 9-h fasted mice. The values are averages ± S.E. (n = 5). *, p < 0.05 between genotypes; **, p < 0.01 between genotypes; $, p < 0.05 between time points.

