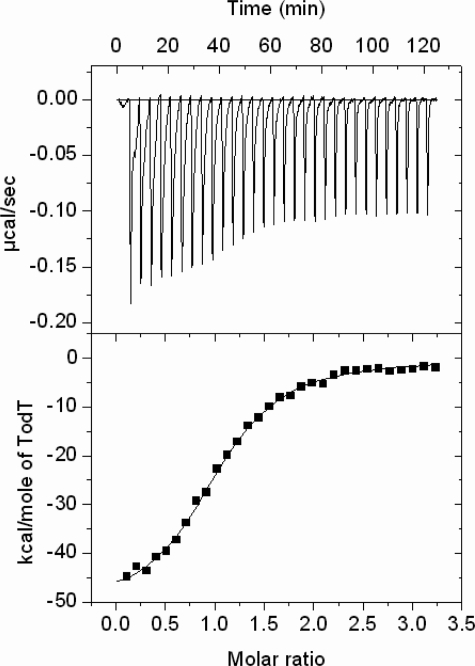
FIGURE 6.
ITC study of the interaction of TodS with TodT. Upper panel, raw titration data of 1.6 μm TodS with aliquots of 23 μm TodT in the presence of 1 mm ATP. For further experimental details see “Experimental Procedures” and Krell (27). Lower panel, integrated and dilution-corrected peak areas from the raw data. The curves were fitted with the “one-binding-site” model of the MicroCal version of ORIGIN.

