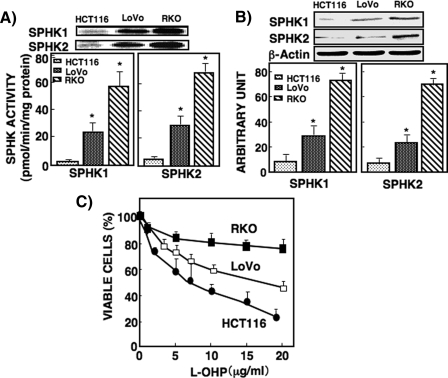
FIGURE 1.
Comparison of SPHK1 and SPHK2 activity and protein expression and the IC50 of l-OHP in HCT116, LoVo, and RKO cells. A, SPHK1 and SPHK2 activities were measured in HCT116, LoVo, and RKO cells as described under ”Experimental Procedures.“ The upper panel shows [32P]S1P bands visualized by autoradiography; the spots of the S1P band were quantified using a densitometer. SPHK activity was expressed as pmol/min/mg protein. B, SPHK1 and SPHK2 protein levels in HCT116, LoVo, and RKO cells were measured by Western blot with antibodies against SPHK1 and SPHK2. β-Actin was used as a loading control. C, HCT116, LoVo, and RKO cells were treated with various concentrations of l-OHP for 48 h and then subjected to an MTT assay as described under ”Experimental Procedures.“ Each point was measured in triplicate, and data are expressed as mean ± S.D. of three different experiments. *, p < 0.05 compared with HCT116.

