FIGURE 8.
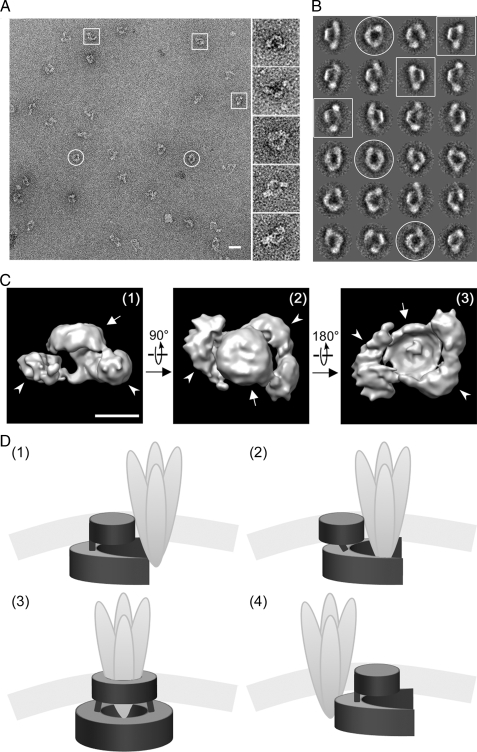
TEM and image analysis of the SPFH1/2 complex. A, a representative micrograph of immunopurified endogenous SPFH1/2 complexes visualized at ×40,000 (scale bar = 400 Å). Putative “top” and “side” views are circled and boxed, respectively. B, 24 class averages, representing ∼50 particles each, resulting from several iterations of multireference alignment and selected for three-dimensional reconstruction are shown, with top and side views indicated as in A. C, final three-dimensional model of the SPFH1/2 complex, determined at a resolution of ∼33 Å and contoured at a volume corresponding to a calculated molecular mass of ∼2 MDa (scale bar = 100 Å). Putative side (1), top (2), and bottom views (3) are shown, with membrane and luminal domains indicated by arrows and arrowheads, respectively. D, four models for how the SPFH1/2 complex (dark gray) might interact with an activated IP3Rs tetramer (light gray). See text for description.

