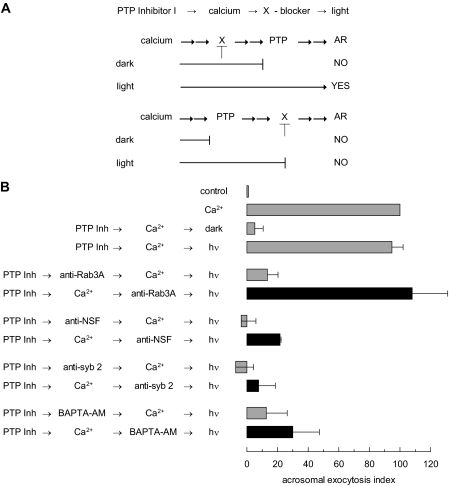
FIGURE 1.
PTP activity is required after Rab3A and before NSF during the AR. A, a schematic representation of the use of PTP Inhibitor I in permeabilized sperm. Shown is the sequence of addition of reagents PTP Inhibitor I → calcium → X-blocker → light. The long lines under the scheme represent the farthest step reached by calcium under each condition. The two possible scenarios: X required before or after PTP, and their different outcomes when tubes are illuminated, AR YES or NO, are depicted. B, SLO-permeabilized spermatozoa were loaded with 0.25 mm PTP Inhibitor I (PTP Inh) for 10 min at 37 °C to prevent all PTP activity. AR was subsequently initiated by adding 0.5 mm CaCl2 (10 μm free calcium, estimated by MAXCHELATOR, a series of program(s) for determining the free metal concentration in the presence of chelators). After a 10-min incubation at 37 °C to allow exocytosis to proceed to the first PTP Inhibitor I-sensitive step, sperm were treated with antibodies that recognize Rab3A (20 μg/ml), NSF (1:300), synaptobrevin 2 (20 μg/ml, anti-syb2), or with BAPTA-AM (10 μm). All procedures were carried out in the dark. The tubes were illuminated with UV light to reverse the block on PTPs at the end of the incubation period (hv), and the samples were incubated for 5 min to promote exocytosis (PTP Inh → Ca2+ → antibody/BAPTA-AM → hv, black bars). Sperm were fixed and AR was measured by FITC-PSA binding as described under “Experimental Procedures.” Several controls were run (gray bars): inhibitory effect of PTP Inhibitor I in the dark (PTP Inh → Ca2+ → dark); and the recovery upon illumination (PTP Inh → Ca2+ → hv); and the inhibitory effect of the antibodies and BAPTA-AM when present throughout the experiment (PTP Inh → antibody/BAPTA-AM → Ca2+ → hv). The data were normalized as described under “Experimental Procedures.” Actual percentages of reacted sperm for control and Ca2+ ranged between 10–41 and 17–53%, respectively. The data represent the mean ± S.E. of at least three independent experiments.

