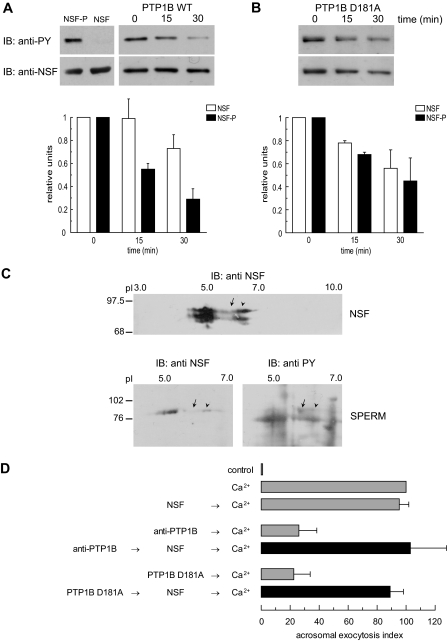
FIGURE 4.
PTP1B dephosphorylates tyrosine-phosphorylated NSF. A: top left, recombinant NSF expressed in E. coli BLR(DE3) (0.5 μg) or expressed and tyrosine phosphorylated in E. coli TKB1 (0.5 μg) were resolved on 8% SDS gels, transferred to nitrocellulose, and immunoblotted (IB) with 4G10 (anti-PY, top) and anti-NSF (bottom) antibodies. Top right, recombinant phospho-NSF (310 nm) was incubated with 1 μg/ml recombinant wild type PTP1B. At the indicated time points, aliquots containing 0.7 μg of NSF were mixed with SDS-PAGE sample buffer, proteins were resolved on 8% SDS gels, transferred to nitrocellulose, and immunoblotted with 4G10 (anti-PY, top). The same membranes were probed (without stripping) with anti-NSF (anti-NSF, bottom) antibodies. Shown is an experiment representative of five repetitions; quantification (carried out with Image J, freeware from NIH) of Western blots is depicted as mean ± S.E. from all five replicates below the immunoblots. B, same as in A, except that the substrate trapping mutant was used instead of wild type PTP1B. The experiment was repeated twice. C, two-dimensional electrophoresis of recombinant, tyrosine-phosphorylated NSF expressed in E. coli TKB1 (20μg, NSF) and solubilized sperm proteins (150μg, SPERM). The first dimension was carried out on precast IPG strips and the second dimension on 8% SDS gels. Proteins were transferred to nitrocellulose, and Western blots were performed with anti-NSF and anti-phosphotyrosine (anti-PY) antibodies as described. pH is indicated on top and Mr standards (×103) are indicated on the left. Shown are images representative of two independent experiments. D, SLO-permeabilized human sperm were treated for 15 min at 37 °C in the presence of 3.3 nm anti-PTP1B antibodies or 300 nm PTP1B D181A, followed by an additional 15 min in the presence of 310 nm recombinant NSF (black bars). AR was initiated by adding 0.5 mm CaCl2 and incubating for 15 min at 37 °C. Controls (gray bars) included AR inhibition by 3.3 nm anti-PTP1B antibodies or 300 nm PTP1B D181A (anti-PTP1B/PTP1B D181A → Ca2+); and AR unperturbed by 310 nm NSF (NSF → Ca2+). The data were normalized as described under “Experimental Procedures.” Actual percentages of reacted sperm for control and Ca2+ ranged between 10–38 and 21–52%, respectively. The data represent the mean ± S.E. of at least three independent experiments.

