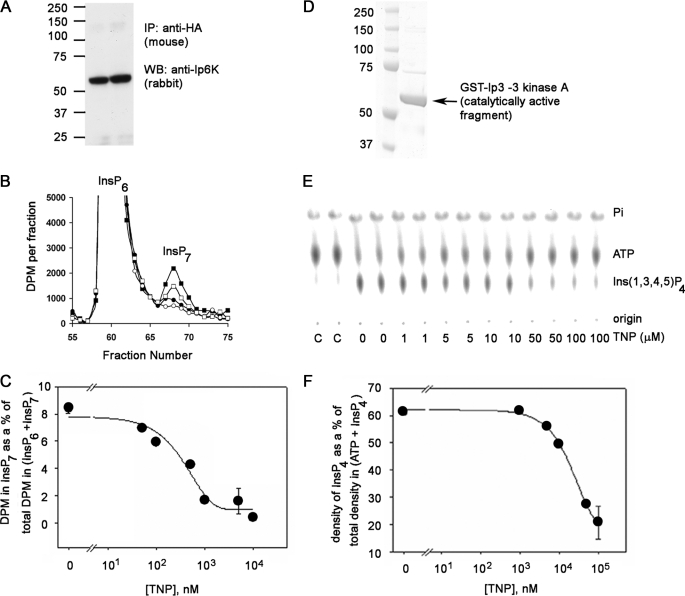
FIGURE 2.
Inhibition of IP6K1 and the IP3-3KA activity by TNP in vitro. A, Western blot (WB) analyses of HA-tagged IP6K1 immunoprecipitated (IP) from HeLa cell lysates transiently transfected with HA-tagged IP6K1, which was used for the activity assays shown in Fig. 3B. The protein was immunoprecipitated using anti-HA antibody (5 μg/mg lysate) and analyzed using the anti-Ip6 kinase panantibody. The molecular mass standards (Prescision Plus Protein dual colored standards from Bio-Rad) are indicated. B, HPLC separation of input [2-3H]InsP6 and [2-3H]InsP7 formed during the IP6K1 assay in the presence of DMSO (filled squares) or TNP at 100 nm (open squares), 1 μm (filled circles), or 10 μm (open circles). During the assay, the immunoprecipitated enzyme was incubated with [2-3H]InsP6 and 1 mm ATP in 200 μl of assay buffer for 1 h at 37 °C on a shaking nutator in the presence of DMSO or TNP (various concentrations). C, determination of IC50 of TNP for IP6K. The percentage InsP7 formed is plotted against TNP concentration. InsP7 formed is calculated as the fraction of the radioactivity in the InsP7 peak to the total radioactivity in InsP6 + InsP7 peaks and expressed as a percentage. The error bars show the range of data obtained from duplicates shown in the chromatogram. Curve fitting to the data was done using the Sigma Plot software. D, purity of the IP3-3KA. 50 ng of purified recombinant fragment of IP3-3KA containing the catalytic domain (∼61 kDa) was electrophoresed on a 4–12% Novex BisTris gel in MOPS running buffer. The gel was stained with Coomassie Blue. The molecular mass standards (same as in A) are indicated. E, dose-dependent inhibition of IP3-3KA activity by TNP. Purified IP3-3KA was incubated with [γ-32P] ATP and 5 μm Ins(1,4,5)P3 in assay buffer at 37 °C for 30 min in the presence of the indicated concentrations of TNP. [32P]Pi,[32P]ATP, and [32P]Ins(1,3,4,5)P4 formed during the IP3-3KA activity assay were visualized after separation by PEI-cellulose thin layer chromatography and phosphorimaging. Positions of reactants and origin are marked on the right. The two leftmost lanes marked C are γ-[32P]ATP controls in assay buffer lacking enzyme. F, determination of IC50 of TNP for IP3-3KA. Ins(1,3,4,5)P4 formed was plotted against the corresponding TNP concentration, by quantifying chromatograms in E using the AIDA software. Curve fitting to the data was done using the Sigma Plot software. The error bars show the range of data obtained from duplicates assayed separately.

