FIGURE 3.
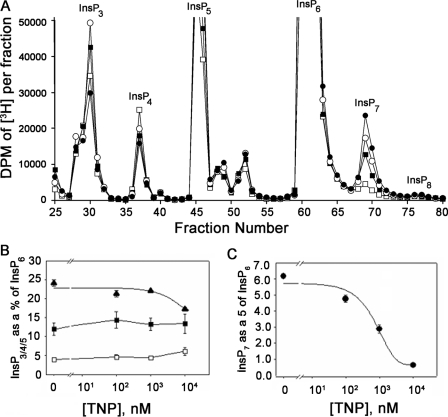
Inhibition of InsP7 formation in TNP-treated HeLa cells. A, HPLC separation of inositol phosphates extracted from HeLa cells stimulated with DMSO (filled circles) or TNP at 100 nm (open circles), 1 μm (filled squares), or 10 μm (open squares) for 2 h at 37 °C. The cells were grown in inositol-free medium supplemented with 10% (v/v) dialyzed fetal calf serum and 50 μCi of [2-3H]inositol for 3 days, and inositol phosphates were extracted (see “Experimental Procedures”). Since the InsP6 peak did not change by more than 10% between all of the conditions (average in control cells = 564,651 dpm and average in cells treated to 10 μm TNP = 599,011 dpm), the dpm in the InsP6 peak was used to normalize levels of other inositol phosphates. In control HeLa cells, the percentages of InsP3, InsP4, InsP7, and InsP8 with respect to InsP6 are 12, 4, 6, and 0.7%, respectively. Similar values for InsP7 and InsP8 have been reported in DDT1-MF2 cells and HEK cells (30). B, change in InsP5 (filled triangles), InsP3 (filled squares), and InsP4 (open squares) normalized to InsP6 in the presence of increasing TNP. In each case, the total radioactivity under the corresponding peak (base line-subtracted) was divided by the total radioactivity under the InsP6 peak (base line-subtracted) and expressed as a percentage. Data are the mean of two different experiments, each an average of triplicate assays, and error bars represent the S.D. of the data. C, TNP-induced dose-dependent decrease in InsP7. For each concentration of TNP, radioactivity in the [3H]InsP7 peak was normalized to that in the [3H]InsP6 peak. Data are the average of triplicate experiments, and error bars represent the S.D. of the data. Sigma Plot software was used to carry out curve fitting to the InsP7 data, and the IC50 calculation was carried out from the equation used to fit the curve.

