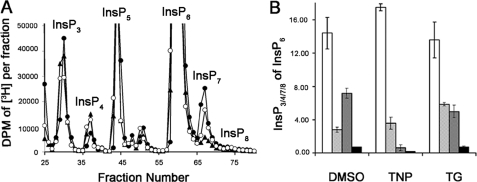
FIGURE 5.
Effect of TNP and thapsigargin on InsP7 isolated from equilibrium-labeled cells. A, HPLC profiles of inositol phosphates isolated from HeLa cells equilibrium-labeled with [2-3H]inositol and stimulated with DMSO (filled circles) or TNP (10 μm; filled triangles) or TG(open circles) for 2 h at 37 °C. B, bar chart showing InsP3 (white bars), InsP4 (hatched bars), InsP7 (checkered bars), and InsP8 (black bars) as a percentage of InsP6 in cells treated with DMSO, TNP, or TG. Data are the average of duplicate experiments, and error bars show the range of data.

