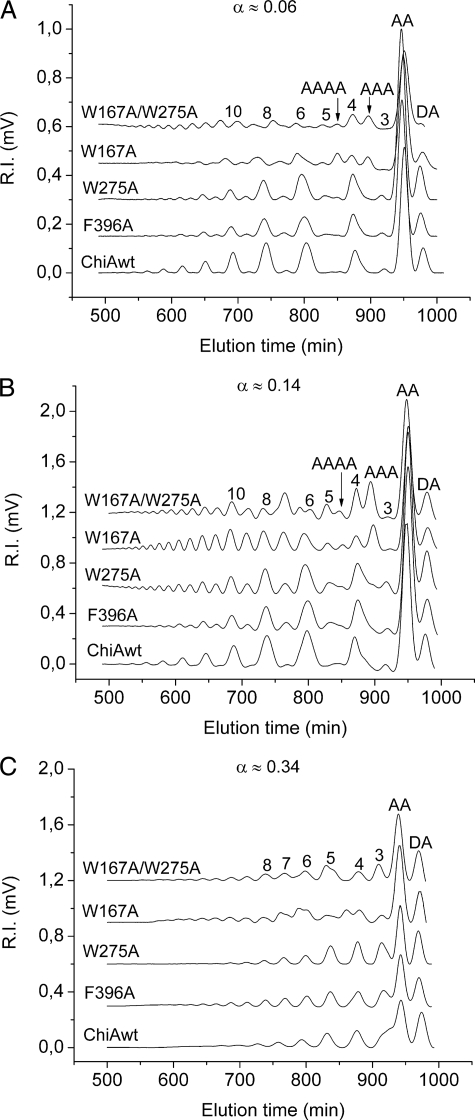
FIGURE 3.
Size exclusion chromatography of oligomer products obtained after the degradation of chitosan (FA = 0. 63, DPn = 800) with wild-type and mutant ChiAs. The peaks are annotated according to their content, either by a sequence (A, acetylated unit; D, deacetylated unit) or by the length of the oligomer (the latter peaks contain oligomers of equal lengths but different compositions and sequences). The annotation of the peaks is based on the use of standard samples and previous sequencing using NMR (31, 38). The chromatograms for W167A and W167A/W275A contain a few peaks that are not annotated (see text). For the reaction samples at α ≈ 0.06 (A) and α ≈ 0.14 (B), a volume corresponding to 20 mg of starting chitosan was used for the analysis. For the near end point samples (α ≈ 0.34, C), a volume corresponding to 10 mg of starting chitosan was used, and detector sensitivity was 4-fold lower. Thus, for quantitative comparison of the panels, the signal in C must be multiplied by a factor eight. α indicates the fraction of cleaved glycosidic bonds, e.g. cleavage of 6% the glycosidic bonds corresponds to α = 0.06. Complete conversion of the substrate to dimers would yield α = 0.50, whereas complete conversion of an FA = 0.63 chitosan is expected to yield a maximum α value in the order of 0.35 (38). See “Experimental Procedures” for a more thorough description.

