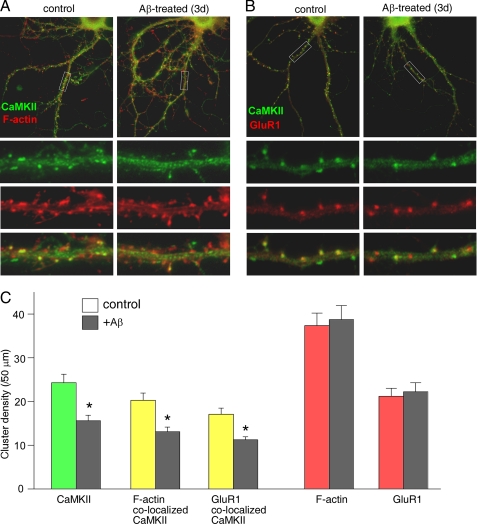
FIGURE 3.
Reduction of synaptic CaMKII clusters in cultured cortical neurons after Aβ exposure. A and B, immunocytochemical images showing the co-staining of CaMKII α subunit with F-actin (A) or GluR1 (B) in cortical cultures (DIV 28) without or with Aβ (1 μm) exposure for 3 days. C, cumulative data (mean ± S.E.) showing the density of CaMKII clusters, CaMKII clusters co-localized with F-actin, CaMKII clusters co-localized with GluR1, F-actin clusters, and GluR1 clusters in control versus Aβ-treated cultures. *, p < 0.01, ANOVA.

