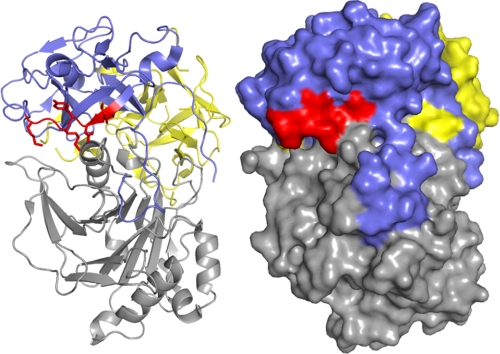
FIGURE 4.
Localization of the CRAC site on CdtC. Ribbon representation (left) of A. actinomycetemcomitans Cdt holotoxin (PDB accession number 2F2F). CdtC is represented in blue with residues Leu-68—Lys-74 of the CRAC site colored red. CdtA is shown in yellow, and CdtB is shown in gray. Shown is a surface representation (right) of the holotoxin indicating the accessibility of the CRAC site.

