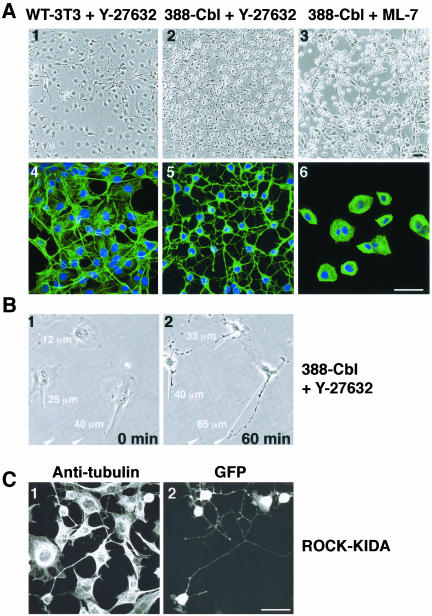
Figure 3.
ROCK inactivation induces changes in cell morphology identical to RTK-induced changes. (A) Phase contrast images (1–3) and confocal immunofluorescence of anti-tubulin antibody and Hoescht staining (4–6) of serum-starved wild-type (1 and 4) and 388-Cbl–expressing NIH 3T3 cells (2, 3, 5, and 6) were taken after a 30-min treatment with Y-27632 (1, 2, 4, and 5) or ML-7 (3 and 6). Bar, 50 μm. (B) Phase contrast images were taken of a group of 388-Cbl–expressing cells before (0 min) and after (60 min) of treatment with Y-27632. The distances represented by the white lines are indicated numerically, and two positional markers are indicated by the arrowheads. (C) After transient cotransfection of 388-Cbl–expressing cells with ROCK-KIDA and NLSGFP–expressing plasmids, anti-tubulin antibody (1) and GFP staining (2) were imaged by confocal immunofluorescence microscopy. Bar, 50 μm.

