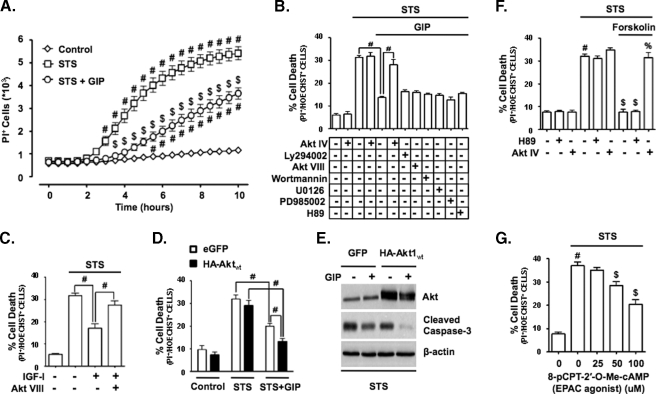
FIGURE 7.
GIP stimulation of survival in STS-treated INS-1 cells involves Akt. A, INS-1 cells were treated without or with 100 nm STS and with or without 10 nm GIP for 10 h, and onset of cell death (defined as propidium iodide-positive (PI+) incorporation into cell nuclei) was measured in real time every 30 min. The mean ± S.E. of dead cells (n = 6) is shown. #, p < 0.05 versus DMSO control; $, p < 0.05 versus STS without GIP. B, cell death (%) in INS-1 cells treated for 6 h with STS (100 nm), with or without 10 nm GIP, and without or with an inhibitor of Akt (500 nm Akt IV), PI3K signaling (15 μm LY294002, 5 μm Akt VIII, or 200 nm wortmannin), Erk1/2 signaling (5 μm U0126 or 50 μm PD985002), or PKA signaling (10 μm H89). Mean ± S.E. of dead cells (n = 6). #, p < 0.05 (comparisons are shown). C, shown is the cell death (%) in INS-1 cells treated for 6 h with STS ± 10 nm IGF-I ± PI3K signaling inhibitor, 5 μm Akt VIII. Mean ± S.E. of dead cells (n = 4); #, p < 0.05 (comparisons are shown). D, shown is the cell death (%) in INS-1 cells transfected with enhanced green fluorescent protein (eGFP) or HA-tagged wild-type Akt1 and treated for 6 h with STS ± GIP. Mean ± S.E. of % cell death (n = 4). #, p < 0.05 (comparisons are shown). E, INS-1 cells were transfected with green fluorescent protein or HA-tagged wild-type Akt and treated for 4 h with STS ± GIP, and Western analysis was performed with indicated antibodies. F, shown is the cell death (%) in INS-1 cells treated for 6 h with STS (100 nm), without or with 1 μm forskolin, and without or with inhibitors of Akt signaling (500 nm Akt IV) or PKA signaling (10 μm H89). Mean ± S.E. of dead cells (n = 6); #, p < 0.05 versus DMSO control; $, p < 0.05 versus STS without inhibitor; %, p < 0.05 versus STS + forskolin. G, shown is the cell death (%) in INS-1 cells treated for 6 h with STS (100 nm) + increasing concentrations of the EPAC agonist, 8-cpt-cAMP. Mean ± S.E. of dead cells (n = 6). #, p < 0.05 versus DMSO control; $, p < 0.05 versus STS without 8-cpt-cAMP. Anti-β-actin blots were internal controls.

