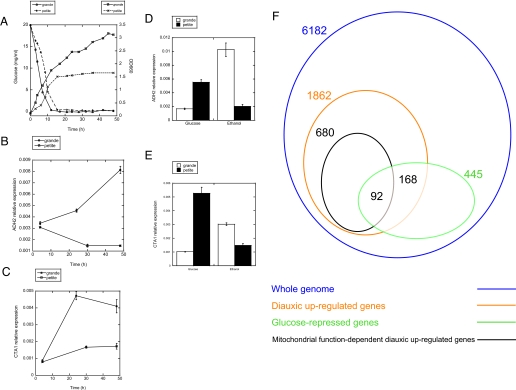
FIGURE 7.
Suppression of induction of ADH2 and CTA1 in respiratory-deficient petite cells during the diauxic shift and upon transfer to nonfermentable medium. A, growth curve of grande and petite cells in YPD medium as monitored by glucose concentration and A660. The expression of ADH2 (B) and CTA1 (C) was quantitated by real time RT-PCR at the indicated times. D and E, logarithmically growing cells were transferred from YPD to YPethanol and incubated for 2 h, and the expression of ADH2 (D) and CTA1 (E) was quantitated by real time RT-PCR. The results are represented as means ± S.E. of relative expression of at least three experiments. F, Venn diagram of the number of whole genome (blue), diauxic up-regulated (orange), glucose-repressed (green), and mitochondrial function-dependent diauxic up-regulated (brown) genes. A cohort of glucose-repressed genes was extracted from glucose pulse experiment (33).

