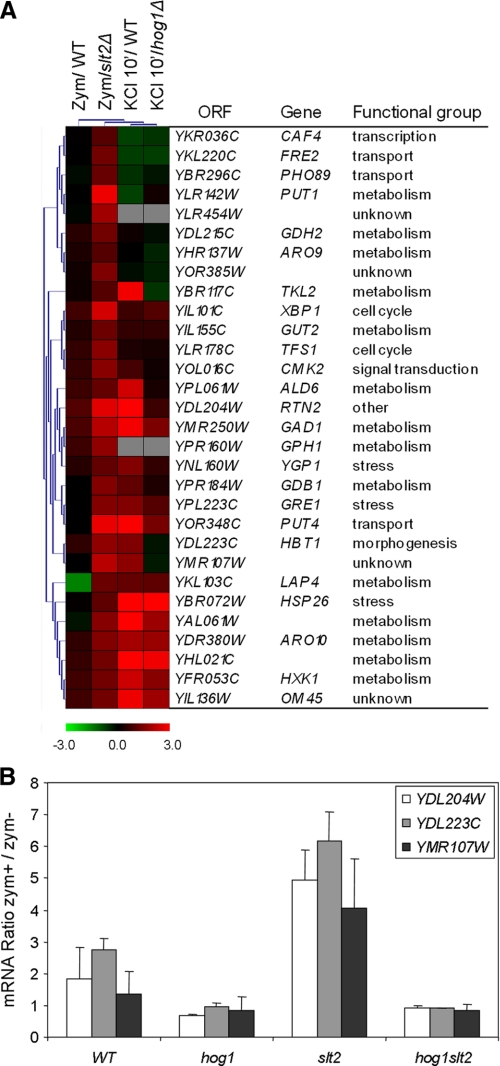
FIGURE 6.
Zymolyase induces a higher osmotic-like response in the absence of SLT2. A, hierarchical clustering of the genes induced by zymolyase in a slt2Δ but not in a wild type strain (Zym/slt2Δ) with other transcriptional profiles: (a) wild type cells treated with 0.8 unit/ml zymolyase for 3 h (Zym/WT) (this work); (b) wild type cells treated with 0.5 m KCl for 10 min. (KCl 10′/WT); and (c) hog1Δ cells treated for 10 min with 0.5 m KCl (KCl 10′/hog1Δ) (25). Each column represents a different condition, and each row represents the ratio of expression for each gene, as indicated in the color scale. B, analysis by quantitative RT-qPCR of the level expression of selected genes alternatively induced by zymolyase in a slt2Δ mutant. The expression of YDL204W, YDL223C, and YMR107W was determined in wild type and hog1Δ, slt2Δ, and hog1Δslt2Δ mutant strains, respectively. The results are expressed as the ratios of zymolyase-treated versus untreated cells.

