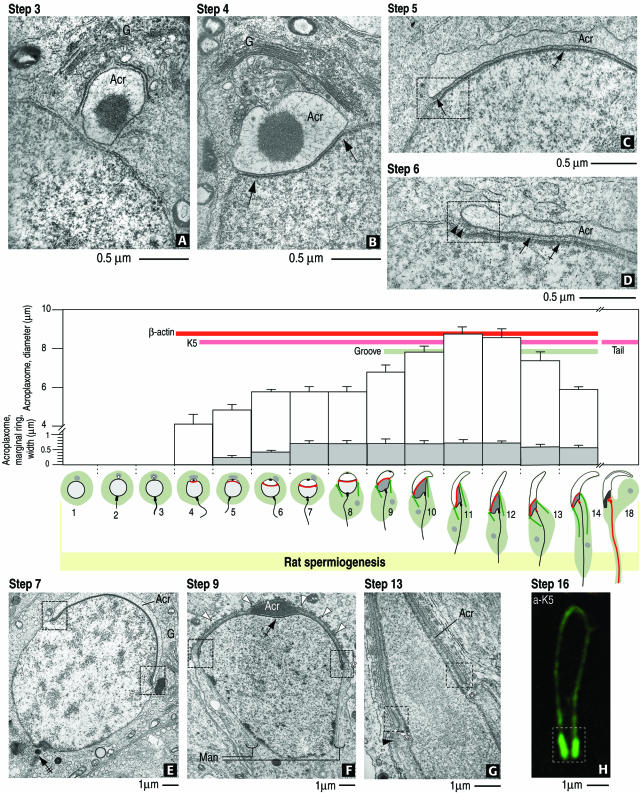
Figure 7.
Summary diagram of the relevant steps of acroplaxome development during rat spermiogenesis and the emergence of β-actin, K5 immunoreactivity, and the groove. (A) Step 3. A Golgi-derived (G) acrosome vesicle (Acr) contacts the nuclear envelope but the acroplaxome is not visualized. (B) Step 4. The acrosome vesicle is lodged in a shallow depression of the nucleus (arrows) where the density of the acroplaxome is seen. (C) Step 5. The inner acrosomal membrane-associated plaque (dashed box) at the leading edge of the acroplaxome (arrow) is detected. (D) Step 6. An intermediate filament bundle (arrowheads) is seen attached to the acrosome (Acr)-linked plaque. The density of the acroplaxome is indicated by the arrows. (E) Step 7. Shallow indentations at the margins of the acroplaxome (dashed boxes) are detected when the acrosome (Acr) initiates its caudal descent. Neither the groove nor the manchette are present. The double-crossed arrow points to the assembling head-to-tail coupling apparatus. (F) Step 9. Elongation of the spermatid nucleus occurs as the marginal regions of the acrosome and acroplaxome (dashed boxes) continue their descent. The manchette (Man) is now assembled. (G) Step 13. A groove belt (asterisks) develops between the acrosome/acroplaxome leading edge (dashed boxes) and the perinuclear ring of the manchette (arrowhead). (H) Step 16. The leading marginal portion of the acroplaxome displays intense K5 immunoreactivity (dashed box). In the bar graph, the white boxes indicate the average diameter (micrometers) of the acroplaxome, and the gray boxes indicate the width (micrometers) of the acroplaxome marginal ring. In the illustrations representing rat spermiogenic steps, the gray region indicates the Golgi apparatus, the white space corresponds to the acrosome vesicle and acrosome, and the red line denotes the position of the acroplaxome. The manchette is indicated by two green lines extending into the cytoplasm. In step 18, the centrosome region (continuous with a long red line representing the developing tail) displays K5 immunoreactivity. The developmental appearance of β-actin and K5 immunoreactivity and the groove are indicated by the corresponding color bars.

