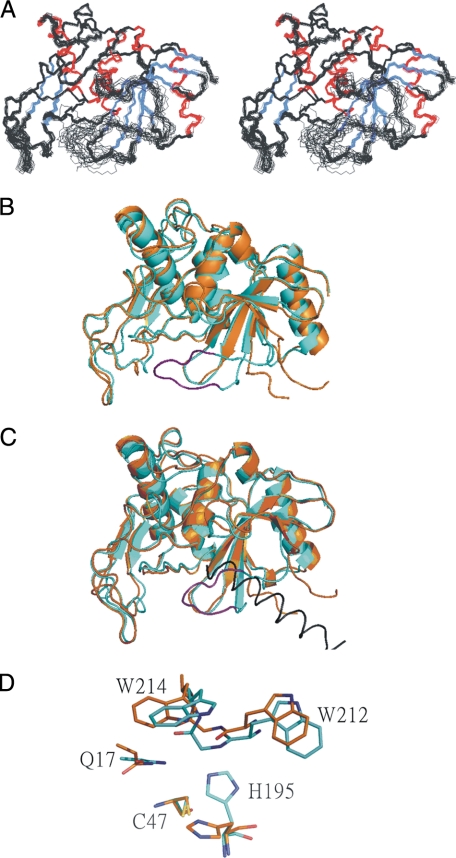
FIGURE 3.
Three-dimensional structure of SPE B. A, stereoview of three-dimensional structures of mSPE B C47S mutant. The α-helix and β-strands are labeled and presented in red and blue, respectively. B, superimposition of x-ray and NMR structures of mSPE B C47S mutant. The x-ray and NMR structures are shown in orange and light blue, respectively. The S230-G239 region of NMR structure is shown in purple. C, superimposition of mSPE B and proSPE B structures of C47S mutant. Only the helix K87p-L107p of prodomain in proSPE B is shown, and it is colored in black. D, active site region of mSPE B and proSPE B. The residues Q17, C47/S47, H195, W212, and W214 at the SPE B active site are shown.

