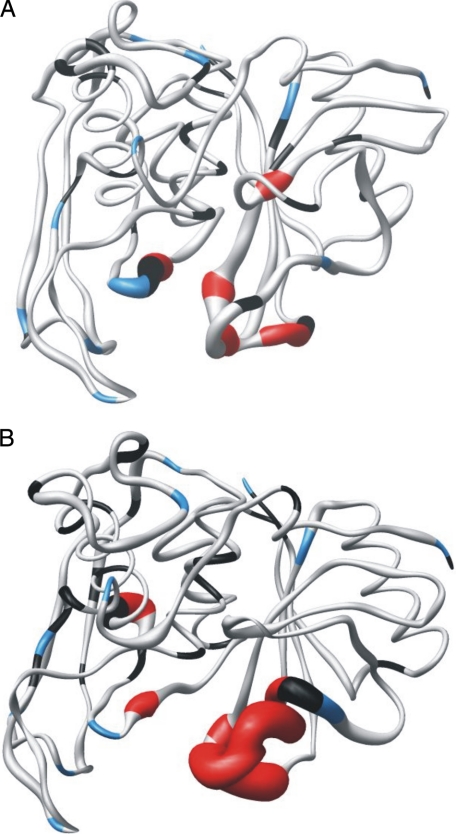
FIGURE 7.
The sausage representations of the dynamics of C47S mutant (A) and the E-64 complex (B) of mSPE B. The diameter of the sausage is inversely related to the order parameter of the corresponding residue. The color-coding is as follows. Gray, model 1; cyan, model 2; green, model 3; orange, model 4; red, model 5; blue, proline residues; black, resonances that were not used to deduce the dynamic information because of weak intensities or multiple decay or an inability to fit them satisfactorily to any model. These images were generated using the MOLMOL program.

