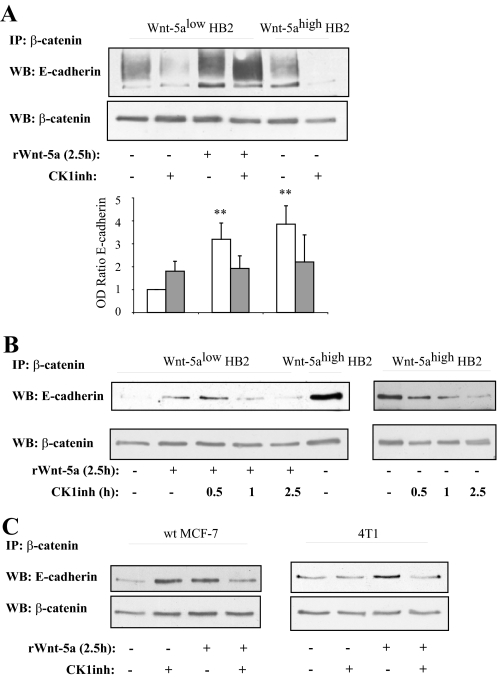
FIGURE 4.
A, the Wnt-5a-induced β-catenin/E-cadherin complex formation is specifically inhibited by the CKI inhibitor only in cells treated with, or expressing, Wnt-5a. The blot shown is representative of several separate experiments and OD measurements of the band intensities were performed to quantify the differences (lower panel, histograms). Error bars indicate S.E., n = 8; *, p < 0.05; **, p < 0.01. B, time kinetics of treatment with the CKI inhibitor indicates that Wnt-5a is upstream of CKI in induction of β-catenin/E-cadherin complex formation (n = 3). C, the Wnt-5a/CKI induced β-catenin/E-cadherin complex formation is also seen in two different breast cancer cell lines: MCF-7 (left) and 4T1 (right). The blot shown is representative of several separate experiments and OD measurements of the band intensities were performed to quantify the differences (supplemental Fig. S2A). WB, Western blot; IP, immunoprecipitate.

