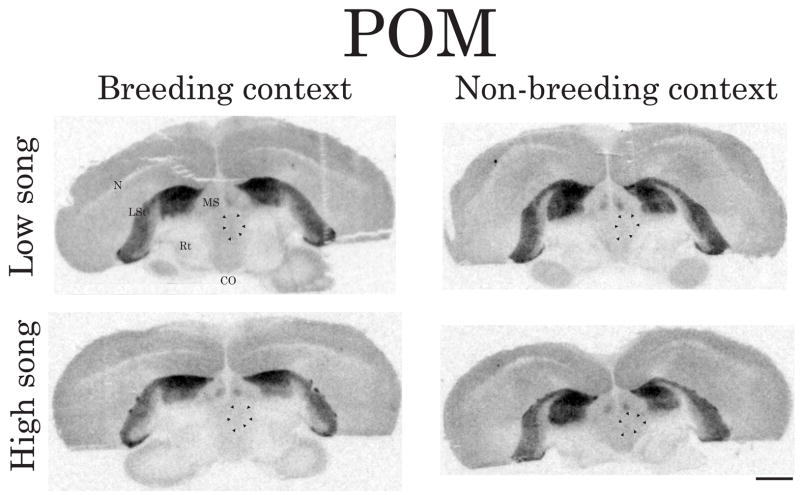
Figure 3.
Representative autoradiograms illustrating the density/distribution of D1-like receptors in coronal brain sections containing POM. Arrows indicate the approximate boundaries of POM (verified in adjacent Nissl-stained sections) in the right hemisphere. The top images are from males singing at low rates and the bottom images are from males singing at high rates. The left images are from breeding context males and the right images are from non-breeding context males. Abbreviations: CO, optic chiasm; LSt, lateral striatum; MS medial septum; N, nidopallium; Rt, nucleus rotundus. The contrast for each image (in this figure and Figures 4–6) was enhanced in an identical fashion for all individuals being compared using Adobe Photoshop Elements 6.0. Scale bar = 2mm

