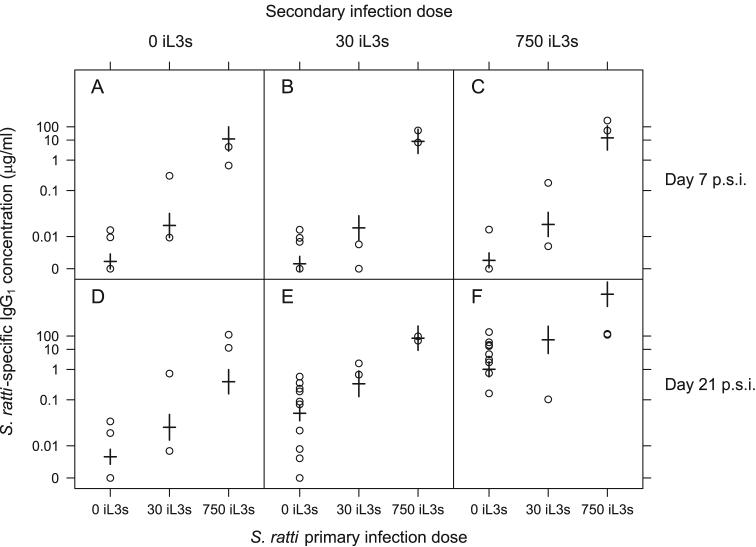
Figure 3.
Anti-S. ratti IgG1 concentrations for three primary S. ratti doses and secondary S. ratti infections at doses of 0 (A, D), 30 (B, E) and 750 iL3s (C, F) at days 7 (A, B, C) and 21 p.s.i. (D, E, F). Results for individual animals are circles, with model estimates from Table 5 shown as horizontal bars with standard errors on these estimates indicated by vertical bars. Data are plotted on a Box-Cox transformed scale. Animals receiving N. brasiliensis or S. venezuelensis primary infections are included in the ‘0 iL3s’ group since these hetero-specific infections had no detectable effect on subsequent anti-S. ratti IgG1 concentration.

