
Figure 3.
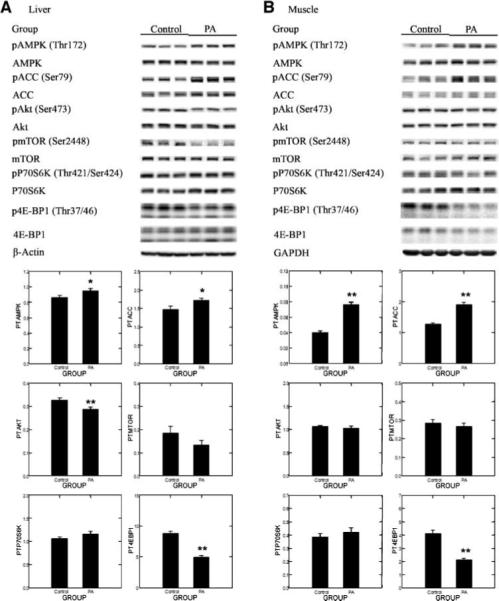
Effects of physical activity on the phosphorylation of AMPK (Thr172), ACC (Ser79), Akt (Ser473), mTOR (Ser2448), p70S6K (Thr389), and 4E-BP1 (Thr37/Thr46) in liver (A) or muscle (B) of rats. Representative Western blot images for the levels of proteins and column graphs for the ratio of phosphorylated to unphosphorylated form (n = 8 for each column). The images shown are those directly acquired from the ChemiDoc work station that is equipped with a CCD camera having a resolution of 1,300 × 1,030. The normalized intensity data from the ChemiDoc were evaluated; statistical analyses were done on the ranks of the absorbance data via ANOVA and/or regression analysis. *, P < 0.05; **, P < 0.01, compared with sedentary control.