Figure 6.
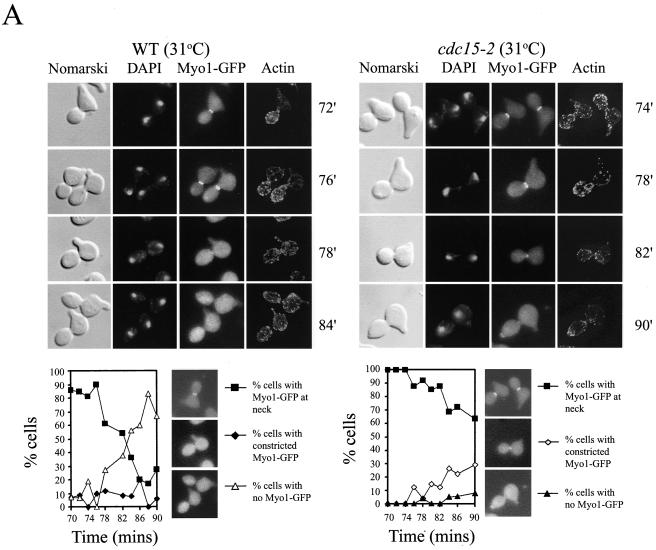
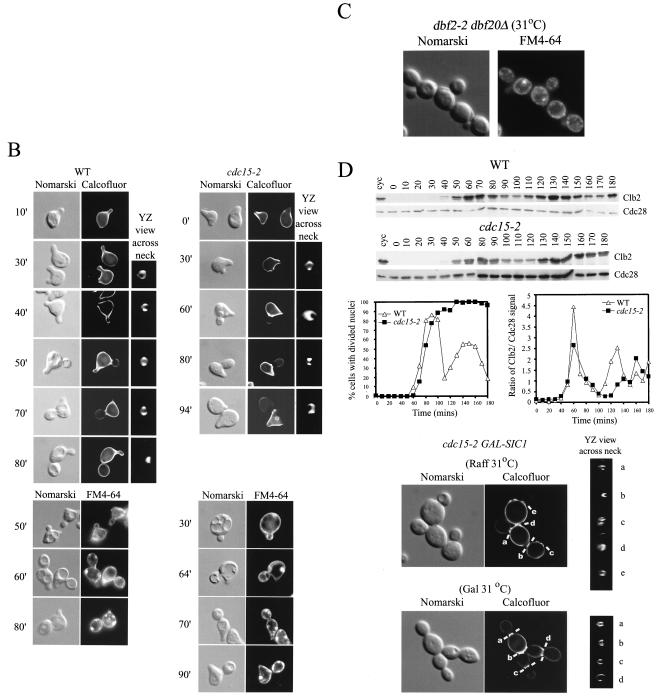
Actomyosin ring constriction and septum formation in cdc15-2 cells at 31°C. (A) Wild-type (US3145) and cdc15-2 (US3122) cells carrying native promoter driven MYO1-GFP (at its native locus) were synchronized in G1 by α factor treatment and then allowed to resume cell cycle progression at 31°C. Samples drawn at various times were analyzed for the presence of Myo1 ring and stained with phalloidin to visualize actin rings. The graphs show the proportion of cells with Myo1 rings at various stages of constriction. (B) Cells were stained with calcofluor and FM4-64 for visualizing primary septum and the cytoplasmic membrane, respectively. (C) dbf2–2 dbf20Δ cells (US2809) were grown in YEPD at 31°C for 6 h and stained with FM4-64 as described above. (D) Clb2 degradation in wild-type and cdc15-2 strains. Cells were synchronized in G1 by α factor treatment and then allowed to resume cell cycle progression at 31°C. Samples drawn at various times were analyzed for Clb2, Cdc28 protein levels and stained with Vectorshield containing DAPI to visualize nuclei. Bottom, cdc15-2 cells carrying GAL-SIC1-cmyc3 were grown in raffinose or raffinose+galactose for 6 h at 31°C. Cells were stained with calcofluor to visualize the septum. YZ views across the cytokinesis sites are shown on the right.


