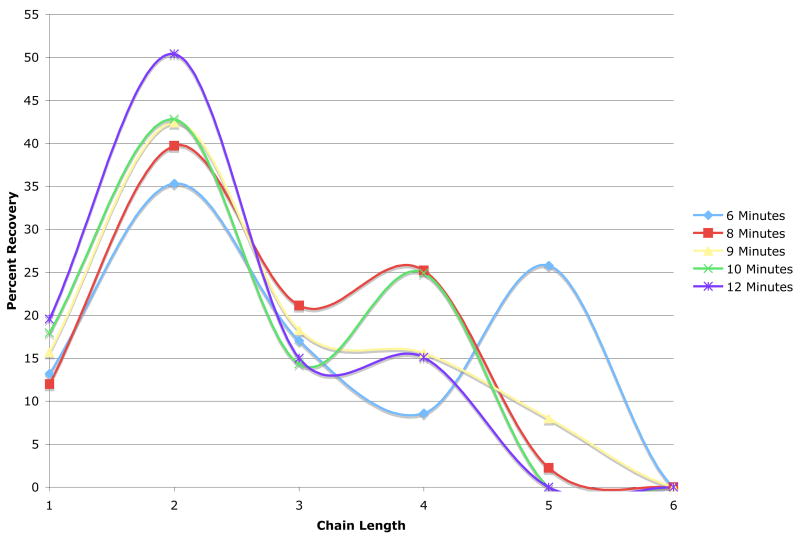
Figure 2. Optimization of Microwave Hydrolysis Conditions for Generating Different DPs of PolySia.
Graph shows the percent recovery of DPs 1–5 as a function of time at 20% power (6 min) and 8,9,10, and 12 minutes at 10% power. Results are representative of the average of two to three trials (Refer to Table 1).

