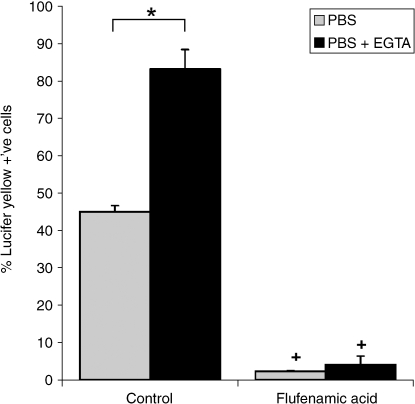
Fig. 1.
Mean percentage of cells showing Lucifer yellow (LY) uptake in the presence of absence of EGTA and with and without pretreatment with flufenamic acid (FFA). Bovine chondrocytes were cultured in agarose for 24 h prior to LY uptake analysis. Error bars represent SEM for n = 3 separate specimens. For each specimen the mean percentage of LY-positive cells was calculated from 10 fields of view. Statistically significant differences based on Student t-tests are indicated at P < 0.05 with and without EGTA (*) and with and without FFA (+).

