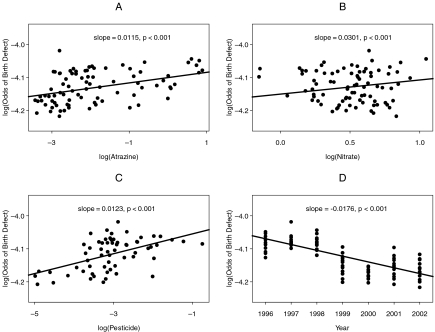
Figure 2.
Plots of log odds of overall birth defect versus surface water concentrations (in log value) and year. Points in each plot represent all monthly observations in years 1996–2002. Solid lines and slopes were estimated from univariate logistic regression models. Units of atrazine, nitrate and pesticide concentrations are μg/L, mg/L and μg/L respectively.

