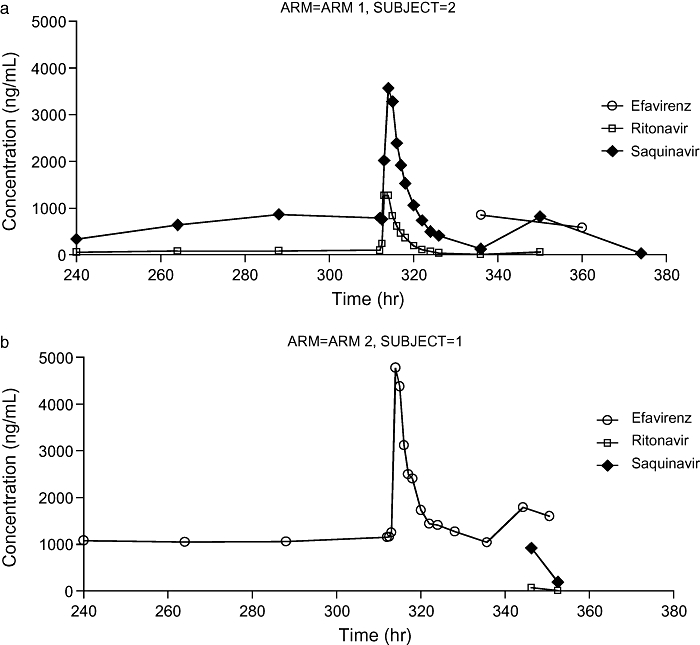
Figure 2.

(a) Plasma concentration-time curves for participant 2, Arm 1. Saquinavir/ritonavir trough concentrations on days 11 to 13 and full pharmacokinetic (PK) profile on day 14 (312 to 336 hours). Sparse plasma concentrations from samples taken after initiation of triple-combination therapy are also shown. (b) Plasma concentration-time curves for participant 1, Arm 2. Efavirenz trough concentrations on days 11 to 13 and full PK profile on day 14 (312 to 336 hours). Sparse plasma concentrations from samples taken after initiation of triple-combination therapy are also shown.
