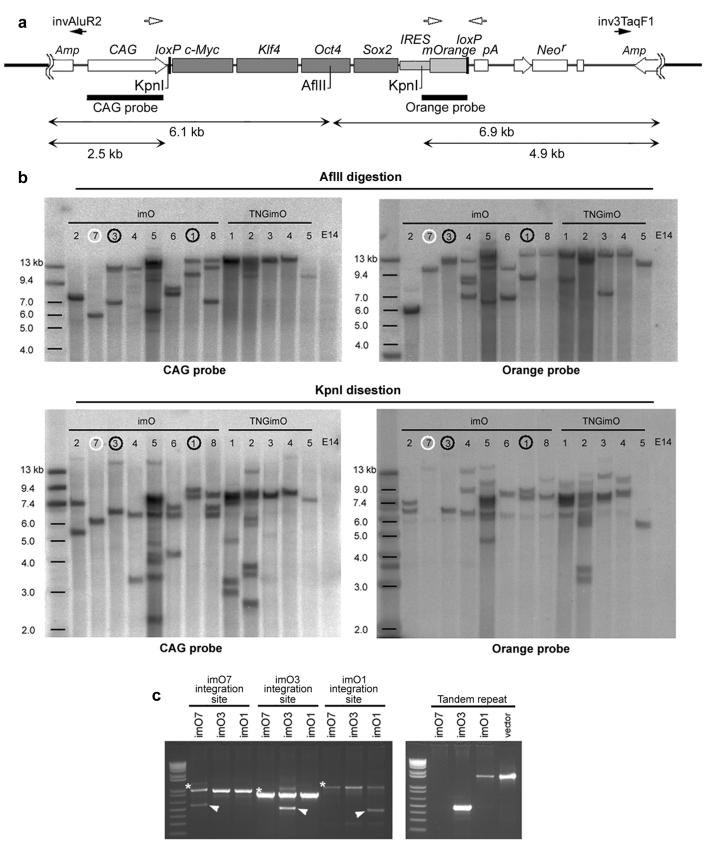
Figure 2. Non-viral iPS cells with a single vctor integration site.
a. Schematic diagram of restriction enzyme sites, AflII and KpnI in pCAG2LMKOSimO and two probes, CAG probe and Orange probe, used for Southern blotting (bars). Black arrows (invAluR2, inv3TaqF1) indicate position of primers used to detect tandem repeat integration in c. b. Southern blotting analysis for AflII (top two panels) and KpnI (bottom two panels) digested genome of imO1-8 and TNGimO1-5, using CAG probe (left panels) and Orange probe (right panels). c. Validation of the integration site and tandem repeat integration. A single integration site of imO7 (white circle in b), and a single integration site with tandem integration (same orientation) of imO1 and imO3 (black circles in b) was identified by inverse PCR (data not shown) and validated by genomic PCR. Asterisk; band from wild-type allele. Arrowhead; integration site-specific band. Detail of the integration site is shown in Supplementary Figure 5. Note different band size of tandem repeats is caused by vector degradation accompanied by random integration.

