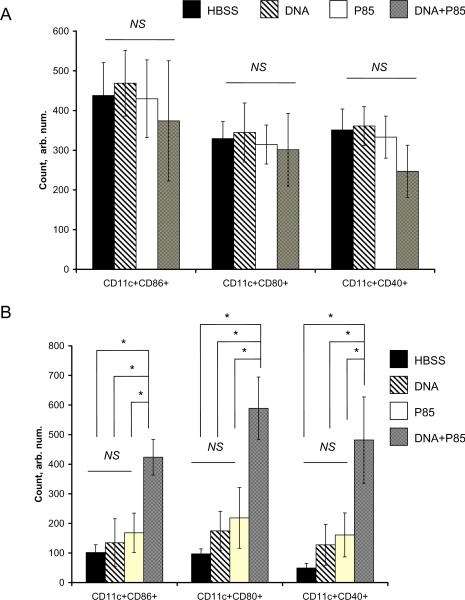
Fig. 10.
CD11c+CD86+, CD11c+CD80+, and CD11c+CD40+ cell frequency in spleen (A) and lymph nodes (B) of Balb/c mice injected with HBSS, DNA, P85 and DNA/P85. The cells frequency was determined by flow cytometry on day 4 after single i.m. injection. Data are mean ± SEM (n = 5). Statistical comparisons between the groups are made using ANOVA: * p < 0.05, NS is not significant.

