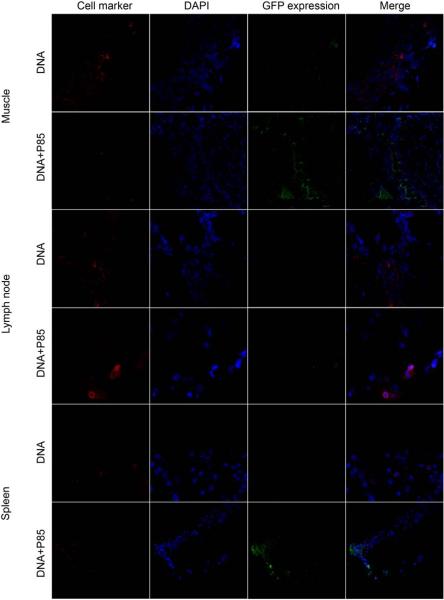
Fig. 8.
Confocal imaging of GFP expression in T-cells in muscle, draining lymph nodes and spleen after single i.m. injection of naked DNA or DNA/P85. The color staining corresponds to T-cells (red), nucleus (blue), and GFP (green). The last panels in each row present digitally superimposed images of three preceding panels to visualize the colocalization (yellow or white). Magnification 63×.

