Fig. 6.
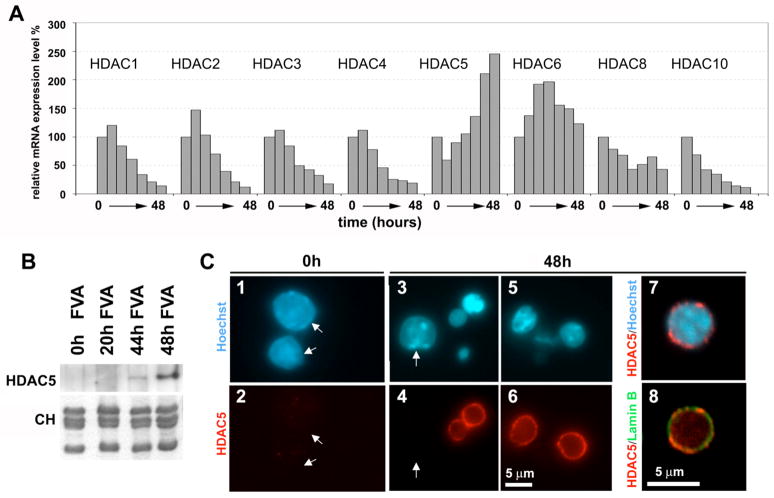
Increased mRNA expression of HDAC5 at the late stage of erythroblast differentiation. (A) Histograms showing relative mRNA expression levels (normalized to the maximal level shown as 100%) as determined by quantitative real-time PCR for HDACs 1, 2, 3, 4, 5, 6, 8, 10. For each HDAC, a set of 7 columns represents PCR experiments with cDNA obtained (left to right) from FVA cells incubated with erythropoietin for 0, 8, 16, 24, 32, 40, and 48 h.
(B) Total protein samples from the nuclei of mouse FVA cells before (0 h) and 20, 44, and 48 h after erythropoietin induction were separated by SDS-PAGE and Western blots probed with antibodies against HDAC5. The bottom panel shows histones from the same samples stained with Coomassie R250.
(C) Immunofluorescence microscopy of FVA cells before (0h) and after (48h) erythropoietin induction stained with Hoechst 33258 (panels 1, 3, 5, 7) for DNA, antibodies against HDAC5 (panels 2, 4, 6, 7) and antibodies against nuclear lamin B (panel 8). Arrows on panels 2, 4 indicate the positions of HDAC5-negative nuclei. Panels 7 and 8 show superimpositions of confocal images (at higher magnification) stained with Hoechst 33258 and anti-HDAC5 (7), and anti-HDAC5 and anti-lamin B (8).

