
Figure 4.
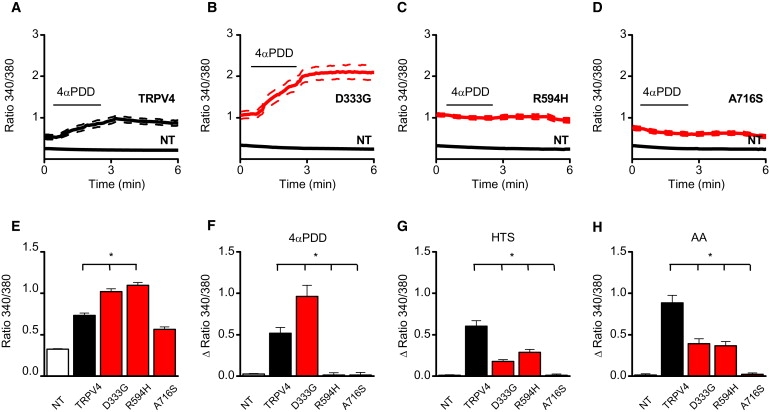
Effect of TRPV4 Mutagenesis on Activation of TRPV4 by Different Activation Stimuli
(A–D) Effect of stimulation with 2 μM 4αPDD on internal fluorescence ratio in wild-type TRPV4 (A), D333G (B), R594H (C), and A716S (D) transfected HEK cells.
(E) Basal internal fluorescence ratio, which is a reference for the basal [Ca2+]i, in nontransfected (NT) and the wild-type TRPV4 and TRPV4 mutant transfected cells, D333G, R594H, and A716S.
(F–H) Average increase in fluorescence ratio in response to 4αPDD (2 μM) (F), a hypotonic stimulus (HTS) (G), and 10 μM arachidonic acid (AA) (H). For every condition, n > 24 in at least three independent recordings. ∗ indicates significant differences when compared with cells expressing wild-type TRPV4 (one-sided Student's t test, p < 0.05). Error bars represent means ± SE.