
Figure 5.
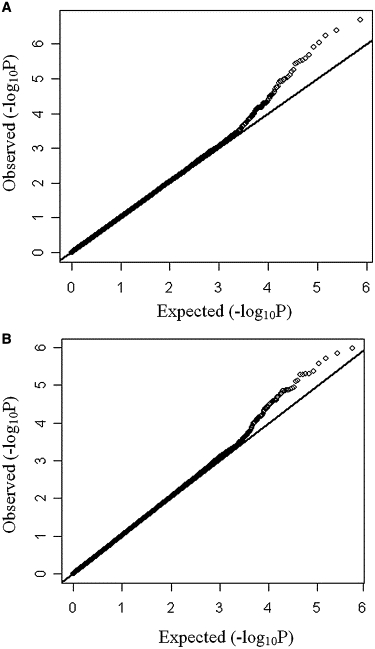
Quantile-Quantile Plots for Hip BMD and Spine BMD Associations
(A) Quantile-quantile plots for hip BMD associations in the GWAS female sample.
(B) Quantile-quantile plots for spine BMD associations in the GWAS total sample.
Axes represent the following information: y axis, observed −log10(p) values; x axis, p values expected under the null distribution for the GWAS SNPs.