
Figure 4.
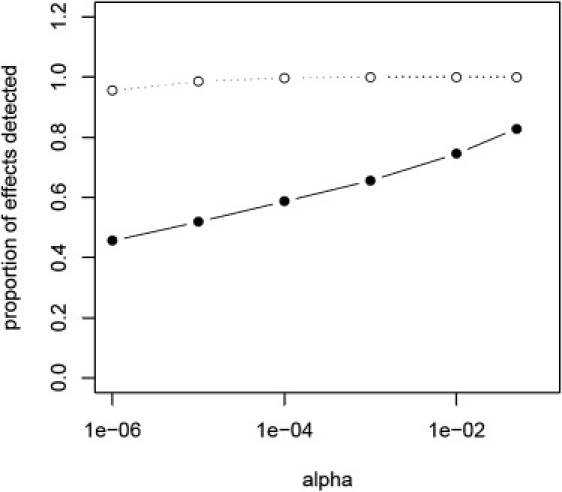
SNP-Transcripts Specific to Disease Are More Likely to Be Discovered in a Cohort with Disease-Specific Samples
The proportion of effects that we could detect from our current study, utilizing brains from LOAD cases and nondemented controls, in a sample of equal size (n = 364) generated by bootstrapping our control data is plotted. The alpha cutoff is plotted on the x axis and the proportion of effects detected is on the y axis. The proportion of eQTLs detected of those that showed a significant diagnosis interaction (α = 0.05 for the interaction term in our 2 df model) is shown by the filled circles and solid line. The proportion detected of those that did not have a significant diagnosis effect (interaction term p value ≥ 0.05) is shown by the open circles and dotted line. Counts and alphas used to generate this graph are given in Table S4.